Handling thousands of controls is easier than you think.
LabVIEW programmers progress from the excitement of the new paradigm to just using it as a tool. We’ve all produced some “spaghetti” code, and we’ve all had to look at somebody else’s flavor of spaghetti and thought “wow – that’s bad”. Somehow, your own spaghetti is not quite as bad as theirs, and we all go through it.
If I were to tell you that I have a front panel with 12889 (twelve thousand eight hundred and eighty-nine) controls/indicators on it, the beginners among you might just drop your jaw and wonder, and declare impossibility, and the more experienced might start having visions of diagram wires packed sixty to the inch and panel controls in 3-point fonts all overlapped and crowded.
And then you might imagine how to make all that work. And then you might imagine why someone would do something like that. And all those visions of spaghetti come dancing in your head.
Calm down and start coding.
Your mission, should you decide to accept it, is to provide a way for your users to display the live data from 300+ channels in several ways:
— A chart, showing the history of 1-4 channels. The history can be the last 30 seconds, or the last 30 hours, or various lengths in between.
— A text table, showing the current value of up to 20 channels.
— A slider table, showing the current value, and recent min/max values for up to 10 channels.
— An X-Y-Z chart, showing the recent history of three channels in X vs. Y vs. Z format.
— An Intensity chart, showing the recent history of three channels in X vs. Y vs. Intensity (color).
— A table, showing the recorded averages over certain periods, for up to 11 channels.
But they don’t want to see JUST a chart, or JUST a table. They want multiple types on a page, and multiple pages.
So, here’s the count:
| Type | Graphs | Channel Selectors |
Value Displays |
Units Displays |
Sliders | History Length |
BG Boolean |
Other | Total |
| Chart | 1 | 4 | 4 | 4 | 0 | 1 | 1 | 0 | 15 |
| Text | 0 | 20 | 20 | 20 | 0 | 0 | 1 | 0 | 61 |
| Slider | 0 | 10 | 10 | 10 | 10 | 0 | 1 | 0 | 41 |
| X-Y-Z | 1 | 3 | 3 | 3 | 0 | 1 | 1 | 0 | 12 |
| Intensity | 1 | 3 | 3 | 3 | 0 | 1 | 1 | 1 | 13 |
| Table | 0 | 11 | 11 | 11 | 0 | 0 | 1 | 2 | 36 |
| Total | 3 | 51 | 51 | 51 | 10 | 3 | 6 | 3 | 178 |
Add 1 for the tab control itself and you have one BLOCK = 179 controls/indicators.
Put six BLOCKs on a tab page and that is 1074.
Have twelve tab PAGEs on the panel and that is 12888, plus one for the tab itself.
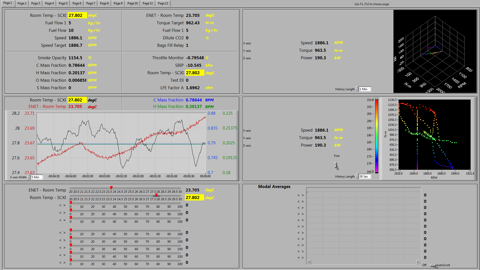
In case you think this might look like a monstrosity, here is a one-eighth size screenshot (Click for full size 1920×1080 pic):
There are lots of tricks to employ to make the work of this a LOT easier. You may not need to cram 12000 controls onto one panel, but these tricks might help you in another way.
Continue on to Part II.


